NU Learning Phase Four: REVEAL
[1] Interpret NU Findings!!!
Which patients are likely to do better on the NEW Treatment than on the CONTROL? And vice-versa?
[2] Address Question of LTD Heterogeneity
In the fourth and final phase of NU Learning, researchers typically revert to using "Supervised" techniques to fit statistical models to observed LTD estimates. The objective here is to determine whether variation in nonparametric LTD estimates can be reliably predicted from the available pretreatment X-covariates.
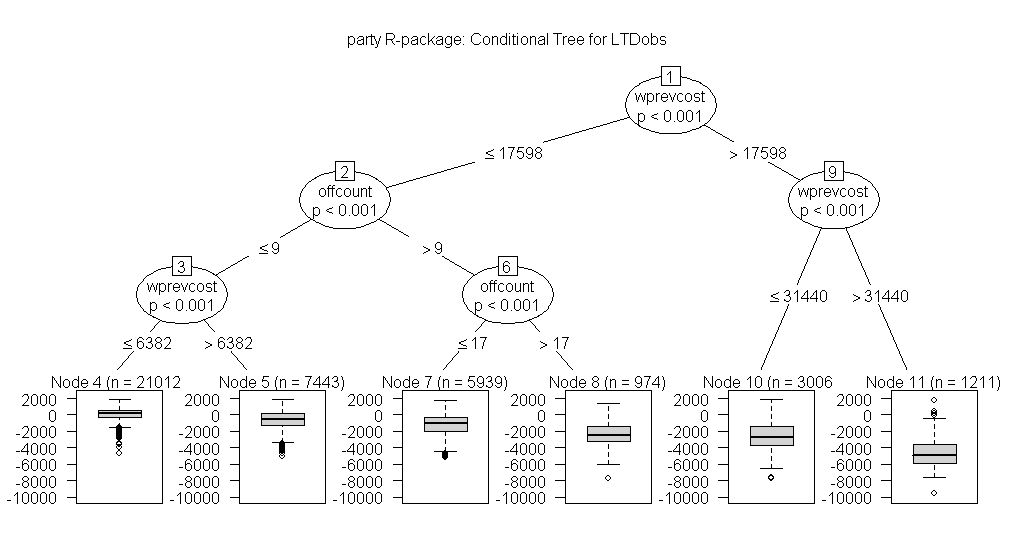
EXAMPLE: NU Learning "Reveal" graphic for 39,585 MDD Patients
Comparison: New/Expensive Treatment for MDD with the current Standard (Control)
LTD Estimates: Local Differences (Treated minus Control) in total Yearly Health Care Cost
wprevcost = Windsorized costs incurred the previous year
offcount = Number of health care Office visits in previous year
The above tree suggests that patients with the highest wprevcost values (>$17,600 and especially >$31,400 in the two right-most terminal nodes, numbers 10 and 11) should choose the New Treatment for MDD. The implied savings in cost (negative LTD estimates) tend to be considerable for patients with high previous year costs.
Actually, the left-most terminal node (number 4) is the only final leaf in which choice of a cost-effective treatment for MDD remains in any doubt. These are the 21,012 patients with wprevcost <$6,400 and offcount at most 9 the previous year. This node contains the lowest percentage (40.2%) of negative LTDs, but its inter-quartile range, [negative $258, positive $601], indicated by the wide box in the I-plot of node 4, straddles zero dollars.
Otherwise, the New Treatment for MDD is rather clearly favored in all final nodes to the right of the left-most-node; these five nodes contain 47.5% of the patients in the database.
The above "Regression TREE" model for predicting LTDs via Recursive Partitioning methodology is not only easily interpretable, visually, but also gives a slightly better fit (R-square = 0.55) than the simple multivariable regression "Covariate Adjustment" models we tried. In fact, "model averaging" across a Bootstrap Forest of 100 such trees gives quite accurate LTD predictions (R-square = 0.95.)
For more detail on this MDD example, see Obenchain and Young (2013) Journal of Statistical Theory and Practice 7: 456-469.
In summary, the observed LTD distribution constructed via NU micro-aggregation is non-parametric; it is constructed without using any formal model that predicts Y-outcome (here, yearly cost => total health care resource utilization.) Thus, when LC reveal-phase model fitting efforts show that these LTD estimates are reliably predictable from pretreatment X-covariates, this is sound evidence that the LTDs are traditional "fixed" effects (rather than merely "random") and establishes their true Heterogeniety (i.e. patient differential response to treatment = formal basis for individualized medicine.)