Here's a really simple "Hospital Mortality" example using data from a 2x2 table. It illustrates an unfair (biased) overall treatment comparison while the corresponding comparisons made within sub-groups of similar patients (columns) are both unbiased!
A "Simpson's Paradox" Example
Where would you want to be treated? Your two choices are a World Class hospital or a Nearby hospital with the following statistics on in-house mortality by disease severity:
Cardiac Mortality
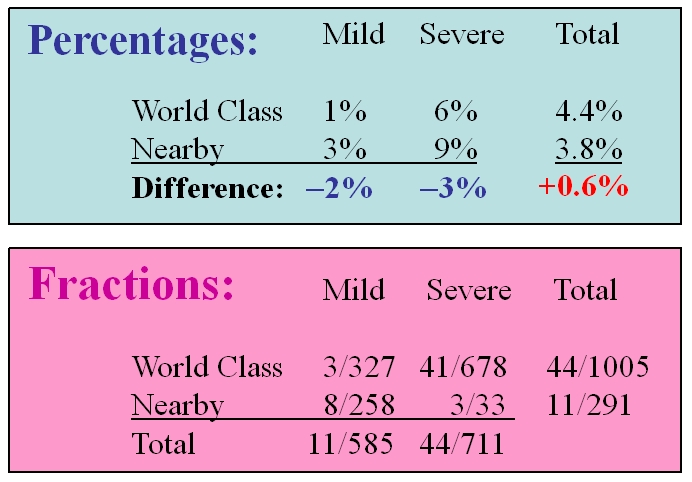
Note that the Nearby hospital could truthfully advertise that it's overall cardiac mortality rate is lower (by 6 tenths of one percent) than that of the World Class hospital. Unfortunately, this claim is actually meaningless in light of the above detail on how mortality varies with disease severity!
The inescapable reality here is that the World Classis hospital has a 2% lower cardiac mortality rate for low severity patients and a 3% lower cardiac mortality rate for high severity patients. The LC "adjusted" main-effect (if all patients were to choose World Class hospitals over Nearby hospitals) would be a mean reduction in cardiac mortality of 2.55%.
This particular World Class hospital has a relatively high overall mortality rate simply because more than two-thirds of the patients it treats have high cardiac disease severity! Society should be happy that the above Nearby hospital is relatively low-volume, treating only 22% of the patients tabulated here.
TECHNICAL NOTES:
Years after the above sort of phenomenon was first discussed in statistical literature, Blyth(1972) declared it to represent a paradox! In reality, this is a relatively common form of CONFOUNDING. In this example, IMBALANCE between treatment cohorts results because cardiac disease severity (low versus high) is associated with both hospital preferences ("World Class" versus "Nearby") and the ultimate outcome (mortality rate.)
The data are presented twice above. The first table displays cell percentages, where the third row represents hospital differences (World Class minus Nearby.) The second table displays mortality fractions (fatalities divided by sample size), where the third row represents total fatalities divided by total sample sizes within columns.
Historical Statistical References:
Yule GU. Notes on the Theory of Association of Attributes in Statistics. Biometrika 1903; 2: 121–134.
Simpson EH. The Interpretation of Interaction in Contingency Tables. J Roy Stat Soc B 1951; 13: 238–241.
Blyth CR. On Simpson's Paradox and the Sure-Thing Principle. J Amer Stat Assoc 1972; 67: 364–366.
Lopiano KK, Obenchain RL and Young SS. Fair Treatment Comparisons in Observational Research. Statistical Analysis and Data Mining 2014; 7: 376–384. View/Download 13-page paper.