[7] ICE Acceptability: VAGR versus ALICE?
The concept of ICE "acceptability" originated in the publication: Van Hout BA, Al MJ, Gordon GS, Rutten FFH. Costs, effects and C/E ratios alongside a clinical trial. Health Econ 1994; 3: 309-319.
The alternative (Acceptability Levels In Cost Effectineness) definition is newer; see Figures 7 and 8 of Obenchain RL. Issues and algorithms in cost-effectiveness inference. Biopharmaceutical Reports 1997; 5(2): 1-7. Washington, DC: American Statistical Association.
As is clear from the following table, the only difference in definitions of "acceptability" between these two alternative approaches occurs within the South-West ICE Quadrant:
|
ICE quadrant |
VAGR Definition |
ALICE Definition
|
|
DeltaC > 0, DeltaE > 0 NE quadrant
|
Acceptable if DeltaC / DeltaE is less than Lambda times s. |
Acceptable if DeltaC / DeltaE is less than Lambda times s = WTP. |
|
DeltaC < 0, DeltaE > 0 SE quadrant |
All outcomes are Acceptable. |
All outcomes are Acceptable. |
|
DeltaC < 0, DeltaE < 0 SW quadrant
|
Acceptable if DeltaC / DeltaE is greater than Lambda times s. |
Acceptable if DeltaC / DeltaE is greater than Lambda /s = WTA. |
|
DeltaC > 0, DeltaE < 0 NW quadrant |
No outcomes are Acceptable. |
No outcomes are Acceptable. |
DeltaC = Incremental Difference in Average Cost (Treated minus Control.)
DeltaE = Incremental Difference in Average Effectiveness (Treated minus Control.)
Lambda is a fixed value for the "Shadow Price of Health"
expressed in DeltaC / DeltaE units.
The standardized ICE slope, s = x/y, is a positive, unitless scalar that is
forced to vary between zero and infinity.
Note that the ALICE approach uses a "kinked frontier" ...with the WTP ray in the NE quadrant having slope Lambda times s while the WTA ray in the SW quadrant has slope Lambda / s. The product of the WTP and WTA slopes thus clearly satisfies Bob O's "LINK" function:
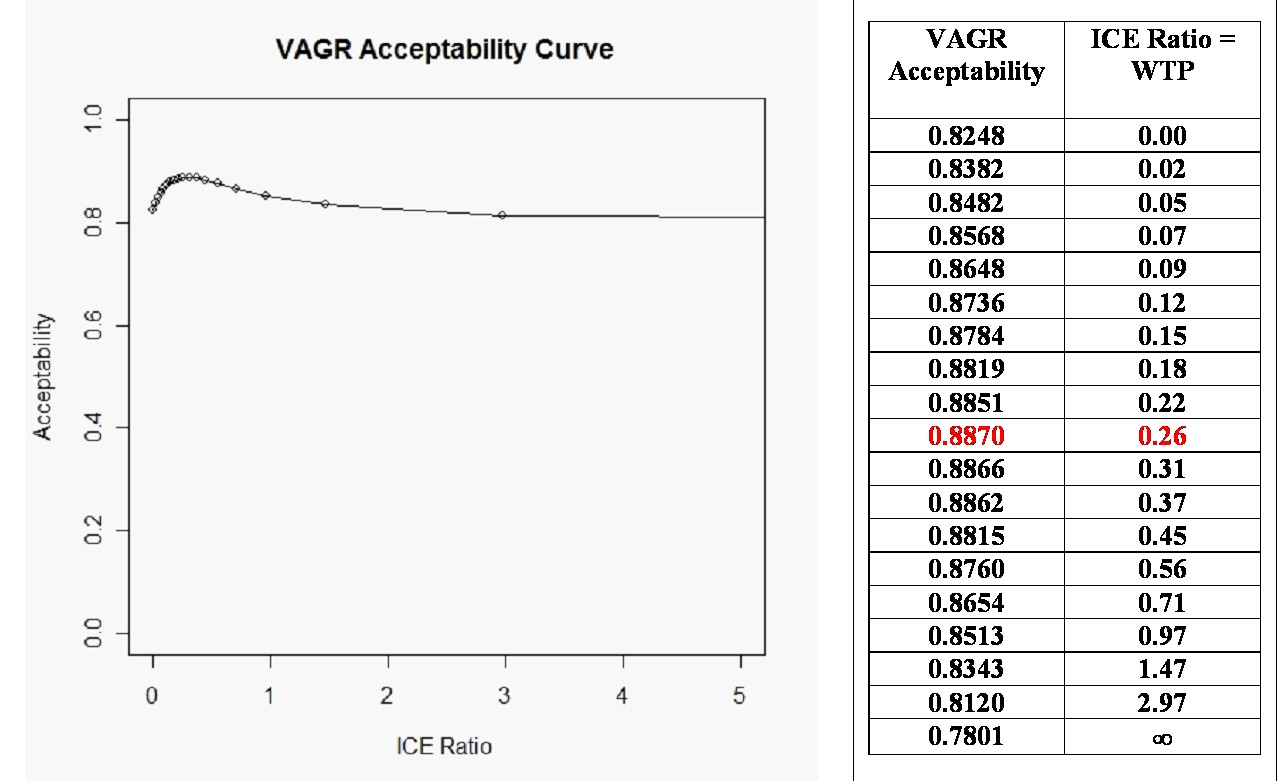
See equation (5) and Section 7 of Obenchain RL. [ICE Preference Maps: Nonlinear Generalizations of Net Benefit and Acceptability. Health Services and Outcomes Research Methodology 2008; 8: 31-56] for a discussion of the following "high-uncertainty" numerical example. Note that the VAGR acceptability curve is non-monotone here and is badly biased relative to the (always monotone) ALICE curve. My ICEinfer R-package contains functions to make bootstrap acceptability calculations and produce the following graphical / tabular displays:
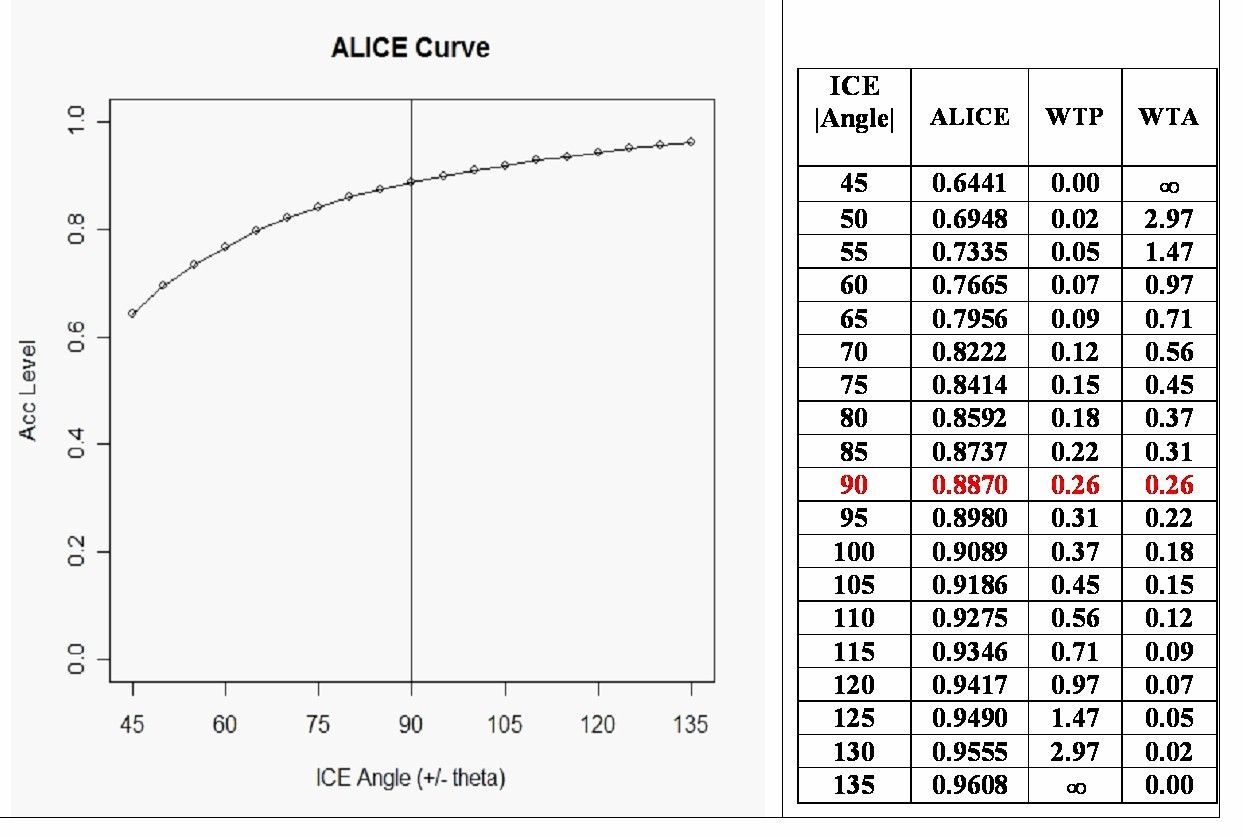
The horizontal axis of an ALICE plot displays ICE angle, theta = 45 + ArcTan(s).
Note that theta increases only from 45 degrees to 135 degrees (a finite range) as
s and WTP increase from 0 to infinity (an infinite range) and as 1/s and WTA decrease from
infinity to 0 (an infinite range.) In fact, WTP = WTA = Lambda only when theta = 90 degrees.