[3] ICE Angle Serendipity
The QUESTION addressed here: Technically, the definition of the Bootstrap Confidence Wedge seems to use only ICE Angle Order Statistics and, thus, appears to totally ignore ICE Radius. Doesn't that mean the observed ICE Radius is rather "unimportant?"
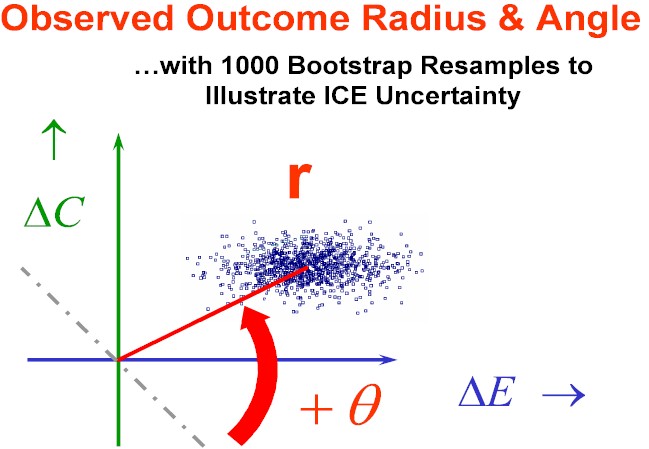
Figure One: Visualization using ICE Polar Coordinates
Here we see a Boostrap Distribution of ICE Uncertainty and the ICE Radius and ICE Angle of its "center point" ...i.e. the point representing the observed pair of Treatment Differences (New minus Standard) in Effectiveness (horizontal) and Cost (vertical.)
Figure Two: Definition of the 95% Confidence Wedge.
Now, we superimpose the pair of ICE Rays defined by "Counting Outwards" from the observed ICE Ratio (Slope) by a specified number of ICE Angle Order Statistics (e.g. 11,875 out of 25,000.)
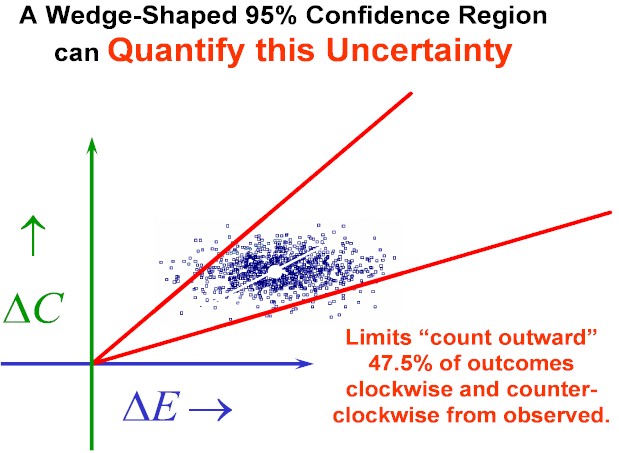
Figure Three: What Would Happen if the ICE Radius were to Suddenly Increase (with Everything Else Held Fixed)?
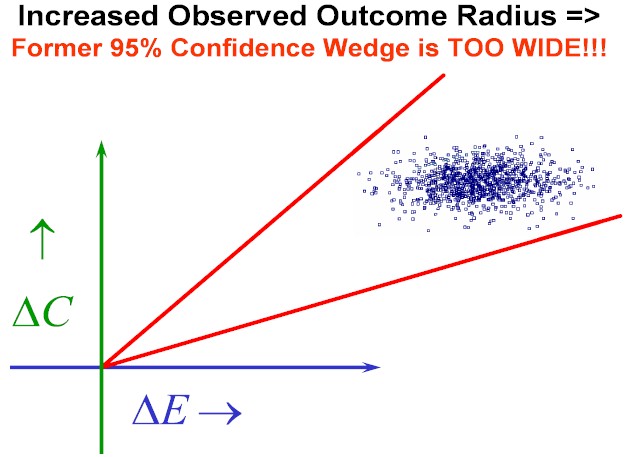
Figure Four: And the Answer is that the 95% ICE Angle Confidence Wedge would then Automatically Narrow as shown here!
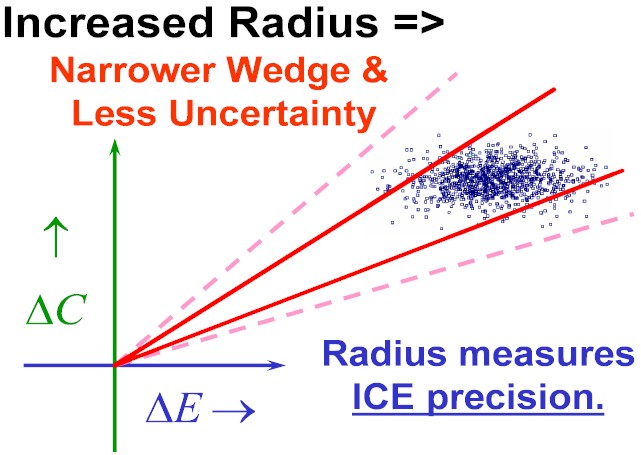
Basing your Confidence Wedge solely upon ICE Angle Order Statistics really Gets you Something for Nothing! While the calculations may appear to ignore ICE Radius they are actually quite sensitive to it ...in the sense that they would automatically adjust for any changes in it.
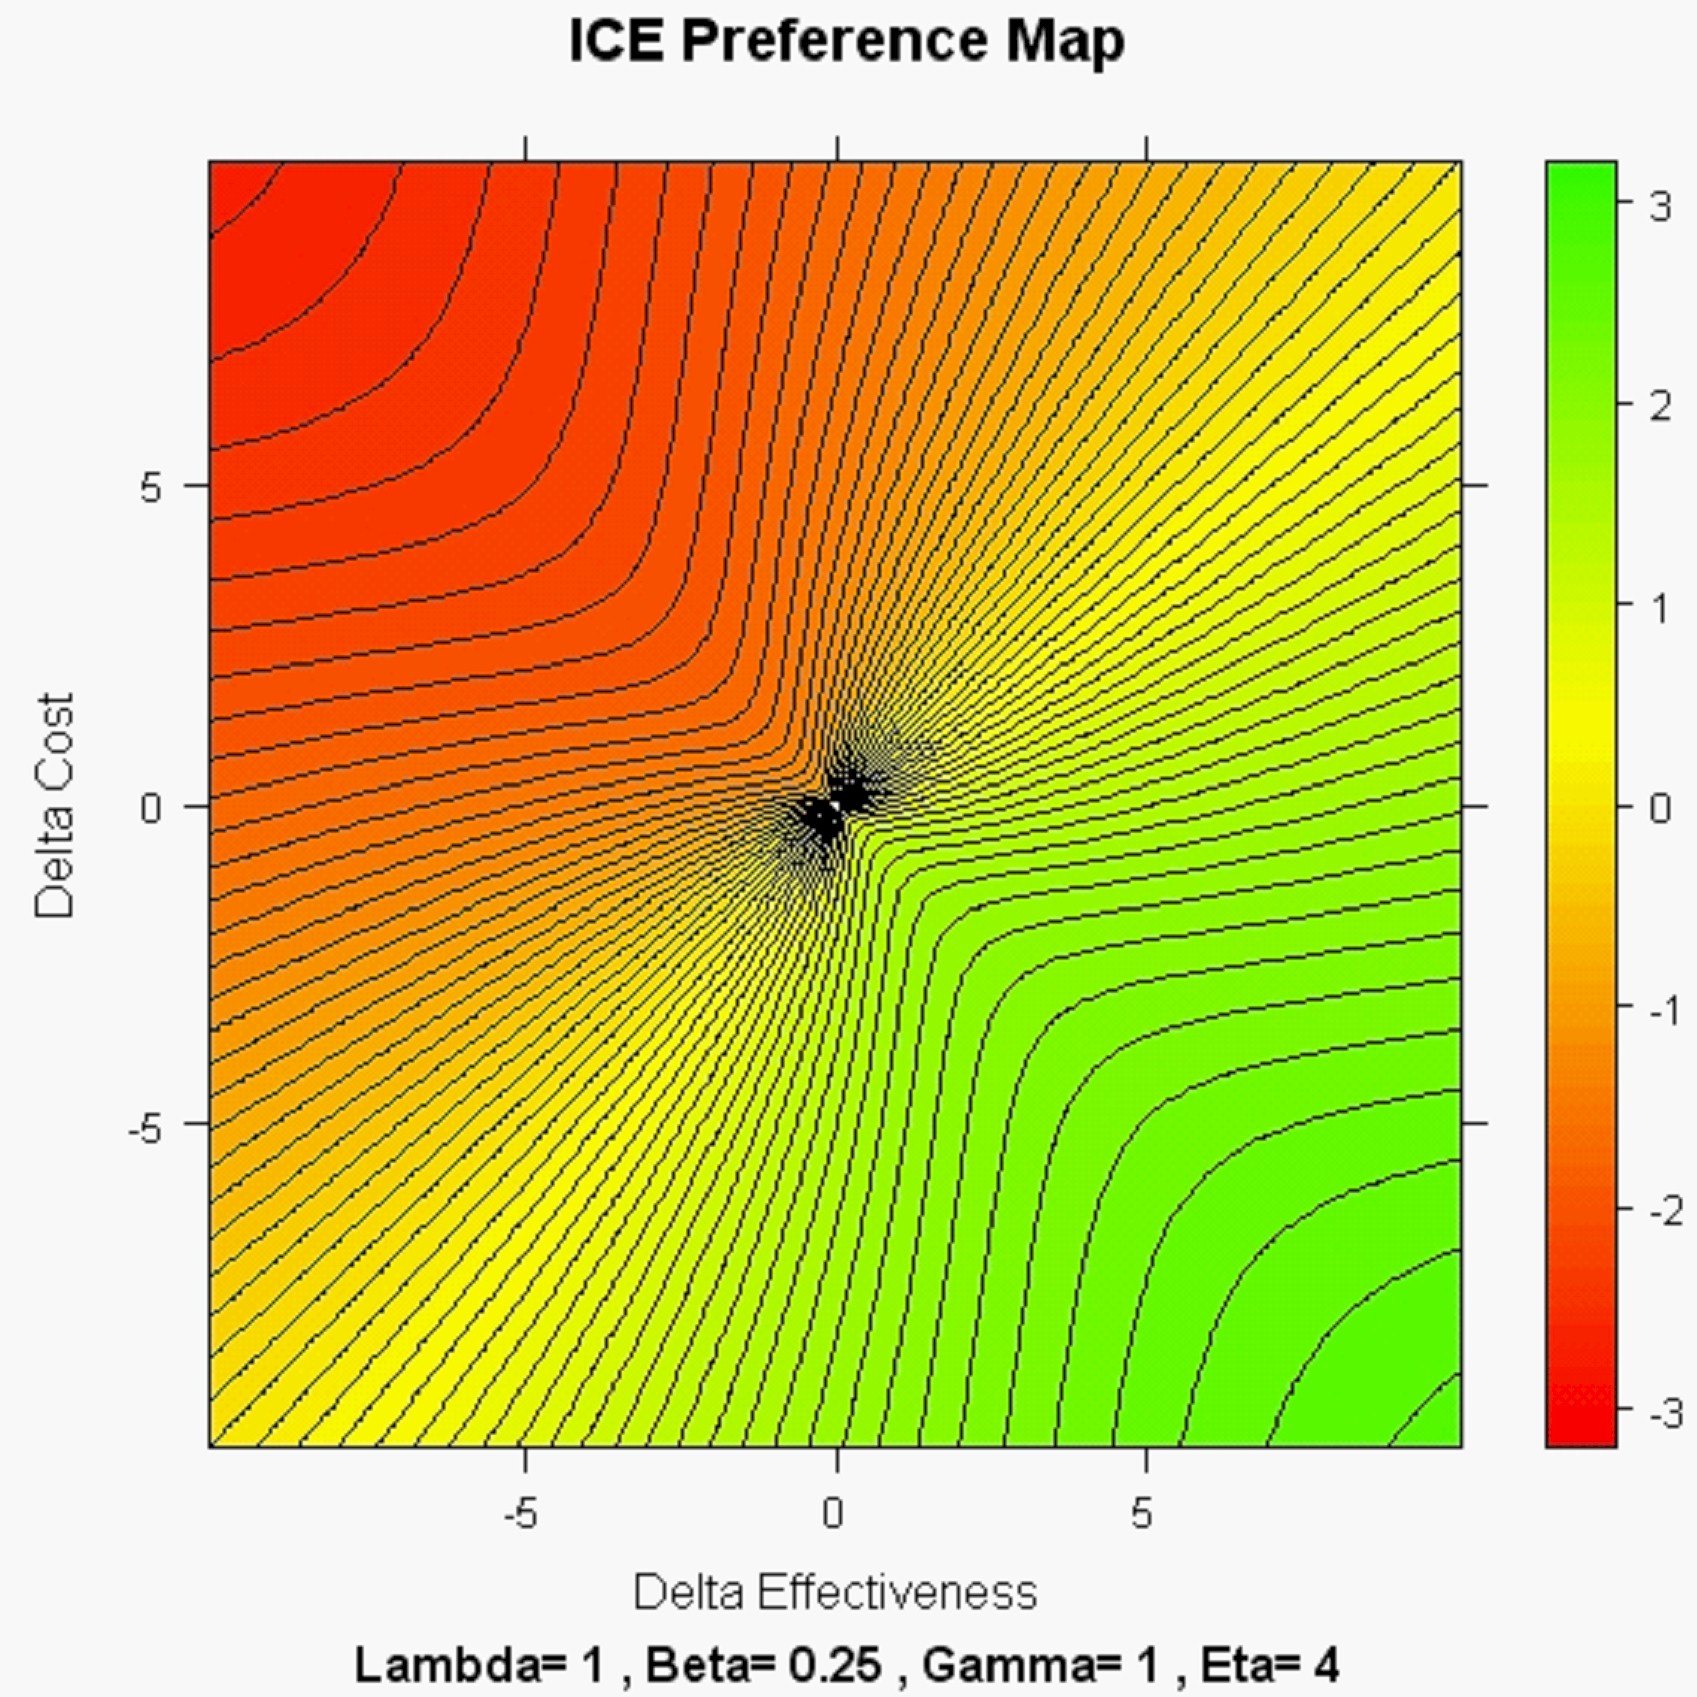
PS. Another key insight into the relative importance of ICE Angles and ICE Radii is provided by the ICE Preference Mapping work of Obenchain(2008.) What do you see in the "highly realistic" NONLINEAR map with Beta < Gamma displayed below? This map tends to be "directional" with the highly desirable property that WTP < WTA below the x = y (lower-left to upper-right) diagonal where New is preferred over the Standard Treatment...