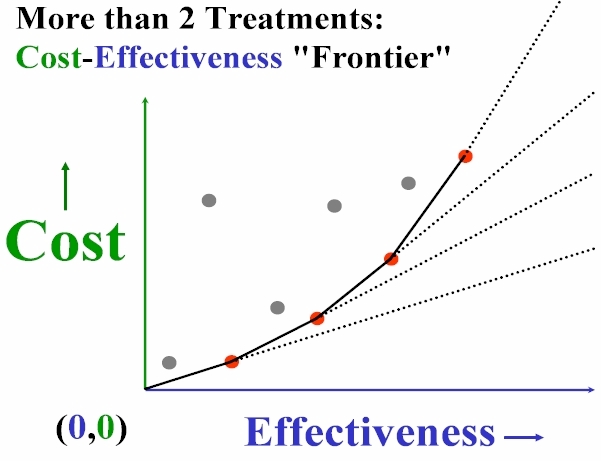
In health economics and pharmacoepidemiology literature, ICE methods are a special case of what is generally called Cost-Effectiveness Analysis (CEA) or Cost-Benefit Analysis (CBA.) When several alternative treatments for a given medical condition are available, treatments not actually on the "Frontier" are not competitive:
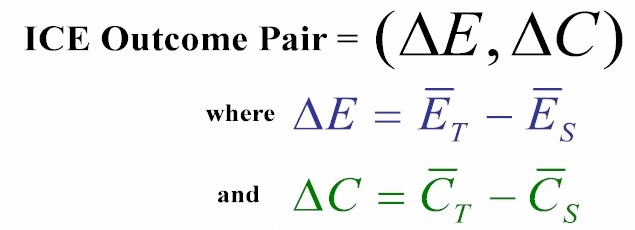
ICE methods address the so-called "incremental" case where just two treatments are compared head-to-head. In typical notation, these treatments are denoted by a subscript of either T => new treatment or else S => standard or control treatment. Overall average differences ("Deltas") on effectiveness and cost are then combined to form a pair of overall outcome differences:
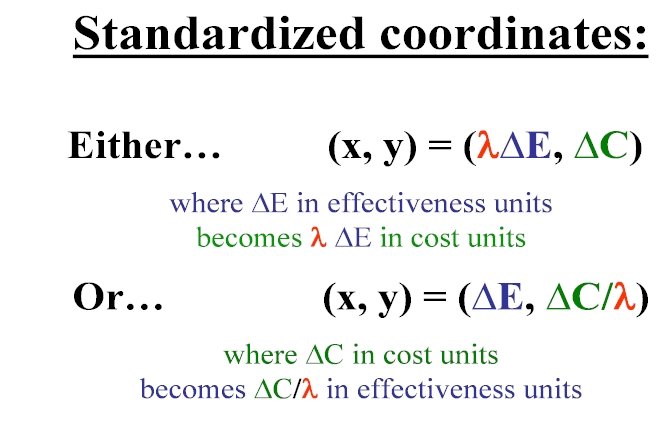
Overall outcome pairs are typically standardized by expressing both of their components in the same units ...of either both in cost or else both in effectiveness. To make this conversion, the numerical value of a truly key quantity (called Lambda) is needed:

Note that Lambda has both the ESSENTIAL property that it is a constant as well as the UNFORTUNATE property that it is an unknown. The most frequently cited numerical value for Lambda is $50,000 per QALY. Unfortunately, converting all of the different effectiveness measure used in various specific disease states into QALYs is a formidable problem. Given some numerical value for Lambda, the standardization process goes as follows:
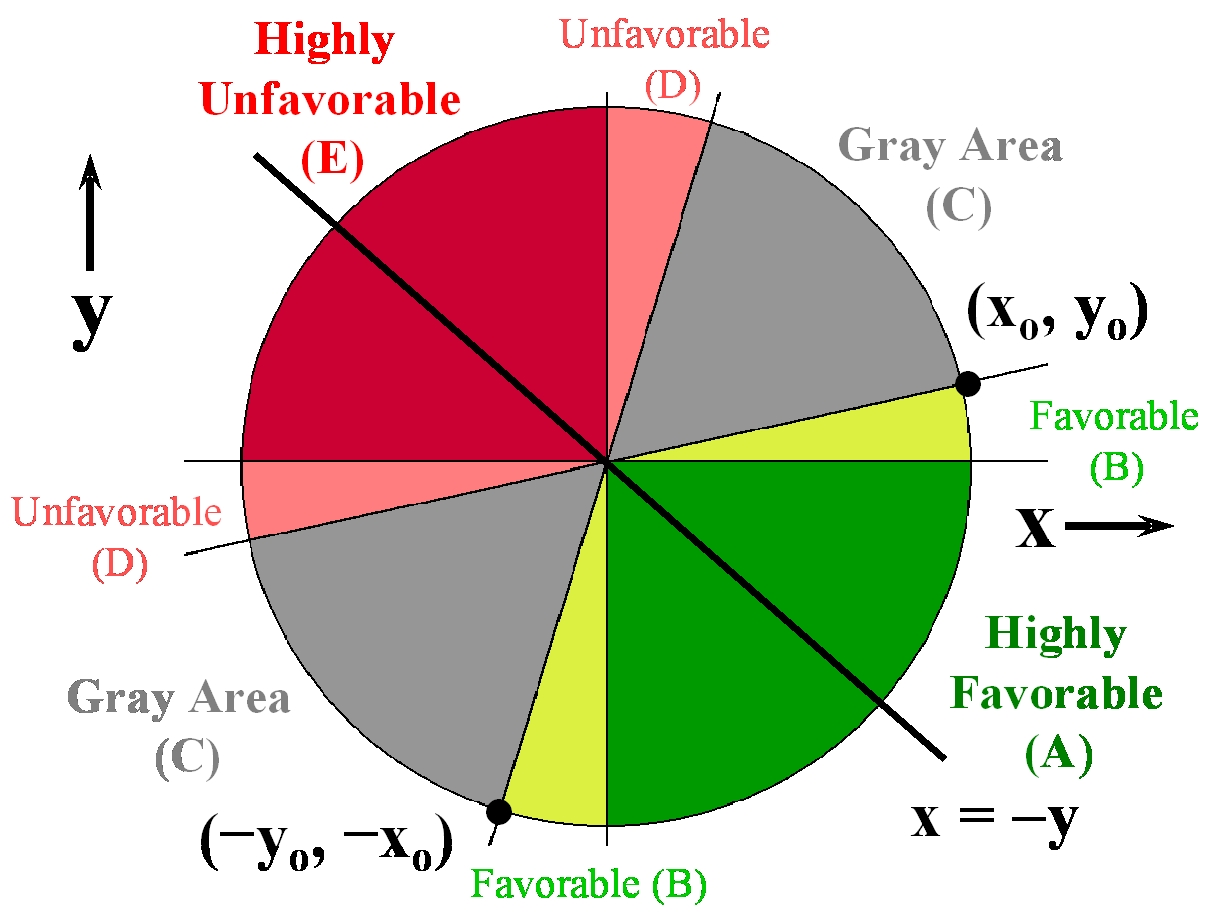
Black WC. [The CE plane. Medical Decision Making 1990; 10: 212-214] suggested using 2-dimensional Cartesian co-ordinates (x, y) in "a graphic representation of cost-effectiveness". Because the x co-ordinate is the average treatment difference in effectiveness while the y co-ordinate is the average treatment difference in cost, a purist might insist that this (x, y) graphical representation should be called the (effectiveness, cost) plane ...but this is not accepted terminology. On the other hand, note that the vector from (0, 0) to (x, y) does have slope s = y / x ...and this statistic is quite appropriately called the standardized ICE Ratio (or ICER.)
Laupacis A, Feeny D, Detsky AS, Tugwell PX. [How attractive does a new technology have to be to warrant adoption and utilization? Tentative guidelines for using clinical and economic evaluations. Can Med Assoc J 1992; 146 (4): 473-81] suggested dividing the ICE Plane up into Wedge-Shaped sub-regions suggestive of a "Pie Chart."