NU Learning Phase One:
(micro-)
AGGREGATE
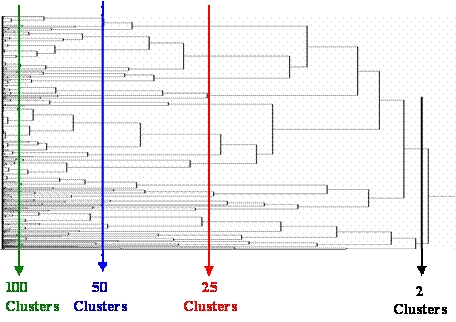
The first phase of NU Learning starts with specifying which of the observed, numerical X-characteristics will be used to Aggregate patients into many, small "local" subgroups. It is convenient to use a (hierarchical) Clustering Algorithm ...where another basic NU "parameter setting" will be NCreq = Number of Clusters requested.
In the illustration below, the overall Clustering Dendrogram (tree) can be cut to produce any desired number of clusters between 2 and about 100. As this NCreq parameter is systematically increased, within-cluster treatment comparisons are forced to become more and more LOCAL (more "fair" and clearly relevant.)
When the two treatment cohorts being compared in an Observational Study have different pretreatment X-covariate distributions, the available data are said to suffer from Treatment Selection (Channeling) Bias and/or X-factor Confounding.
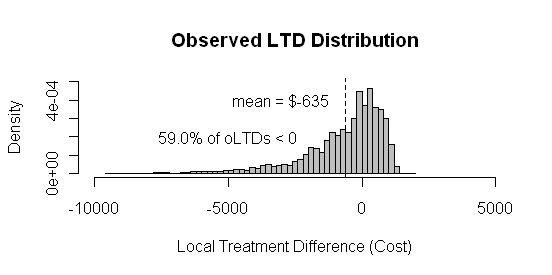
The key graphical display examined by a researcher in Phase One of NU Learning is a HISTOGRAM depicting the "Local Treatment Difference (LTD) distribution" that results from making only WITHIN-CLUSTER treatment comparisons. Clusters containing either only treated patients or only control patients provide no information for making treatment comparisons and, thus, are said to be "uninformative."
Data: 40,000 patients diagnosed with Major Depressive Disorder (MDD)
Comparison: New/Expensive Treatment with the current Standard (Control)
LTD: Difference in total Yearly Health Care Cost
NCreq = Number of Clusters Requested = 2,000
Number of "Informative" Clusters = 1,901 (containing 39,585 patients)
Note that the observed LTDs for 59% of the patients in the database are NEGATIVE. That is, in spite of its higher initial acquisition cost, choosing the New Treatment would result in an overall net savings for the majority of MDD patients.
On the other hand, patients with POSITIVE estimates for their LTDs are better off choosing the standard (control) treatment.
The final phase of NU Learning will reveal which patients should make which treatment choice!
For more detail on this MDD example, see Obenchain and Young (2013) Journal of Statistical Theory and Practice 7: 456-469.